
According to the research, our brain values visuals more than any given information. 50% of the brain is active in visual processing. The human brain can process an image in just 13 milliseconds.
Nowadays, the world is rapidly changing day by day with the help of technology. Companies are mostly relying on data in order to get more precise and accurate goals. About 43% of companies are data-driven companies in 2021 AD.
However, to perform data analysis we have to go through different processes like data mining, data visualization, data processing, and modeling. Among all these data visualizations is one of the important key factors for data analysis.
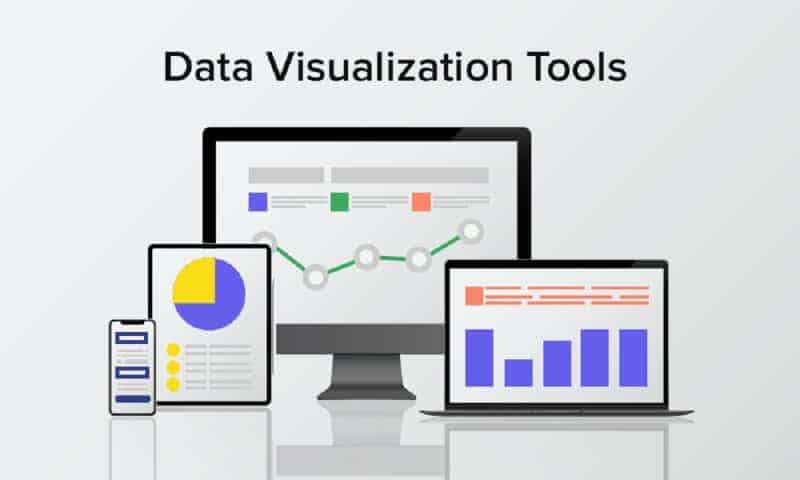
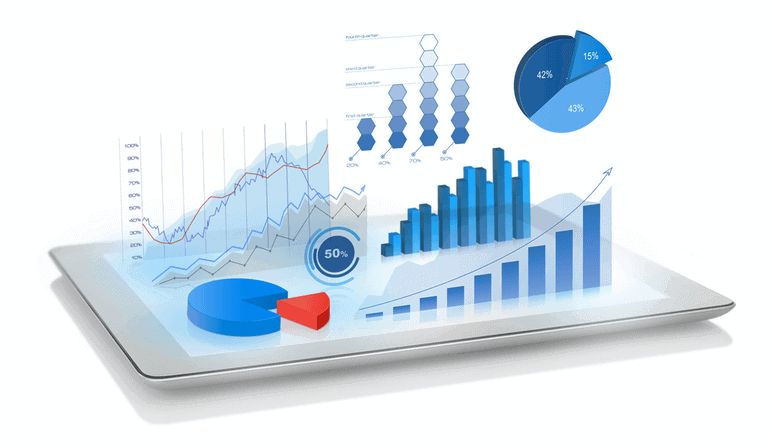
Data Visualization is the graphical representation of information and data. The information and data are in the form of charts, diagrams, pictures, etc.
Therefore, it enables business owners to see analytics presented visually. Thus. helps to understand patterns, concepts, etc.
Data Visualization gives us a clear idea of what the information means by giving it visual context through graphs or pictures. Therefore, it allows business users to get insight from their vast big data.
In addition, it helps them to analyze and make decisions more effectively with the help of it. It also helps to save the consumption of time. Because if the data are not visual context, then it will be difficult for the users to differentiate problems.
Data Visualization tool is a form of software that helps to design the visual context from big information and data. There are different types of tools for data visualization which helps in a tremendous way for visual context.
According to their specifications, analysts used it by providing an interface, database connections, and machine learning all in one place.
Here are the top 10 best Data Visualization tools. They are mentioned below:
The top 10 Best Data Visualization Tools are :
Tableau is one of the most popular data visualization tools compared to others. It helps to take in data and produced the data in a visual context within a short period of time.
In addition, it also helps to provide the highest level of security. And guarantees to handle security issues as soon as they arise.
Looker is another data visualization tool. It helps to go in-depth with data and process it to provide visual data.
Furthermore, It also provides real-time dashboards of data. And the visual context can be shared with anyone with the help of tools in order to go in-depth.
Zoho Analytics obtain data from multiple sources and mixed it up to make multidimensional data into visual context. Because of that, it helps to analyze data from one department to another.
Zoho Analytics also helps to share data with colleagues through spreadsheets, excel, MS Word, etc. However, it costs $34.1 per month.
Sisnese helps to provide various tools that allow data analysts to simplify complex data and obtain insights for the organizations as well as outsiders. Matter of fact, it provides the best tools for data analytics.
Well, with the help of IBM Cognos Analytics anyone can use to interpret complex data into graphical representations and share it with colleagues.
In contrast, you don’t need to be skillful to use IBM Cognos Analytics as its main mission is to make every company a data-driven company.
Domo contains multiple visualize tools that help data analysts to interact with other users. And it helps to make it easy to understand big data through different processes.
In the same way, we can use Domo for a limited time period. It is free and later on has to pay.
Qlik Sense is a software-based platform that helps to combine, load, visualize and explore data. No matter what’s the size of the data, Qlik Sense still helps to convert in the form of visual context.
Although, Qlik Sense is free for 30 days. After that, companies have to pay to move on to the paid version.
Klipfolio is easy to use data visualization tools as it helps to take data from spreadsheets, excel, MS Word, etc. We can choose the different visual contexts such as charts, diagrams, bars, etc.
Similarly, it comes with 14 days for free and after that, it takes $49 per month.
Microsoft Power Bi is one of the affordable data visualization tools. Similarly, it helps to convert information and data into graphical representations.
In addition, it provides multiple supports systems like live chat support with staff. It cost $9.99 per month.
SAP Analytics Cloud is one of the data visualization tools platforms that helps to evaluate and predict the outcomes from given information and data. Furthermore, it helps to alert data analysts for errors in data and changes in data.
Similarly, it is free for a 30 days trial period and charges $22 per month.
It depends on the preference and requirements of the company. But, in my opinion, Tableau is the best data visualization tool.
Tableau is the most popular and easy-to-use data visualization tool. In addition, it is one of the powerful tools that help to integrate numerous data from different sources. And gives output in the various forms of visual context.
Besides, it provides a high level of security for the data.
Sign up to stay updated with the latest insights, news, and more.