
In this guide we will learn to configure some basic alerts. We will understand and configure alert evaluation logic and make sure that the alert goes to our desired notification channel.
In my previous blog we learnt how to setup SMS api in grafana. Now we will continue from the previous blog and simply create an alert and make sure that our alert goes to our phone as sms. We can also configure the alerts to go to our email, rocketchat channel or slack channel and many more. However we will only be focusing on sms alert for now.
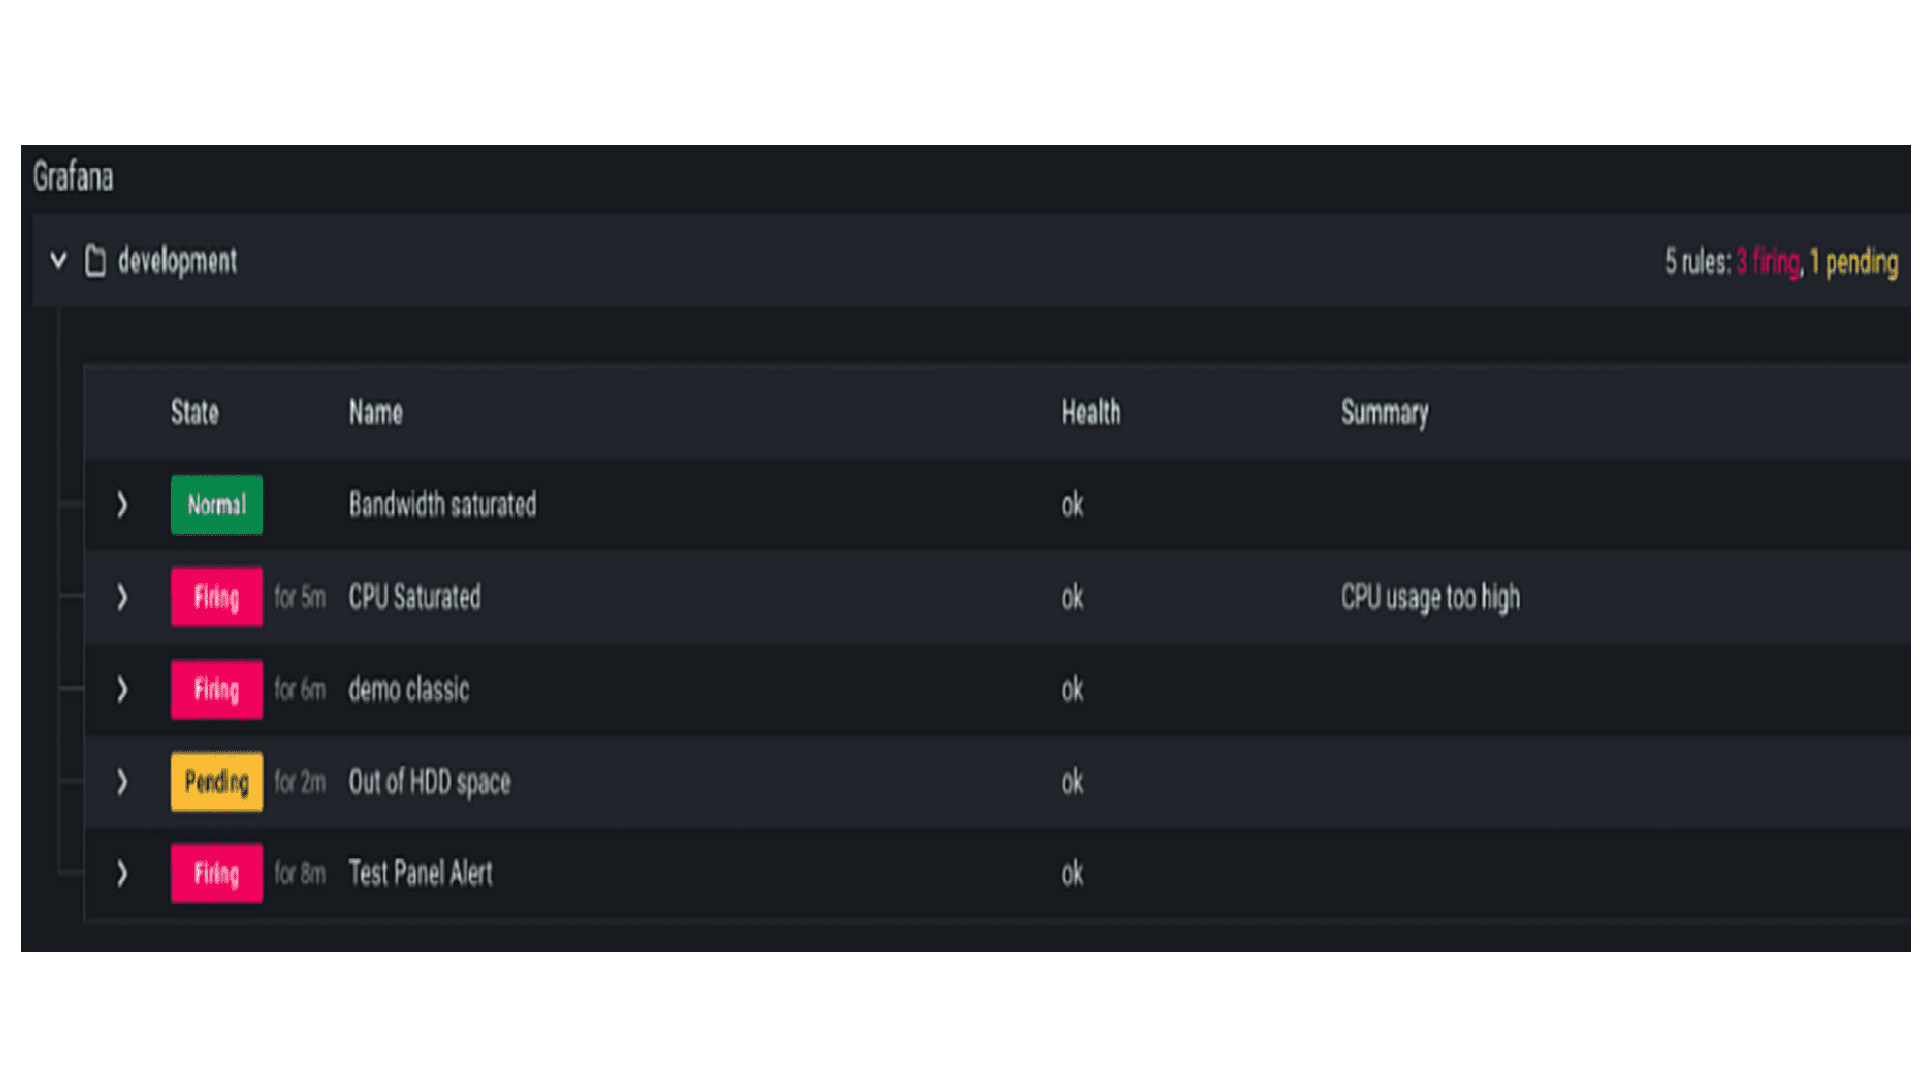
Before creating an alert lets look at some of the different types of alert that can be useful for us:
The above 3 alerts are very basic alerts that can be useful for us. These alerts alone can help us enough to reduce the downtime of our production servers. Morever if we also keep track of various processes and its resource consumption, then we can figure out the cause of abnormal CPU spike or memory usage spike and optimize our applications to prevent these from happening again.
In this guide ill show you how to configure alert whenever our server is down and CPU usage is high. We will be using CPU BUSY section of node_exporter dashboard to configure alert.
So what will happen when our server goes down? We wont be receiving any value in CPU usage section. Hence we will use this to configure the alert. Whenever there is no value in CPU usage, alert will be sent to our phone.
STEP 1:
Hover your mouse above CPU BUSY and press E to edit.

STEP 2:
Change data visualization to time series, go to alert section and then click on Create alert rule from this panel.

STEP 3:
Change the value to 30s for highest response time. This is our query section and it keeps on getting new data as times goes on. If you set it to 30 second then whenever our server goes down, within 30 seconds grafana will know that there is no value in CPU utilization.
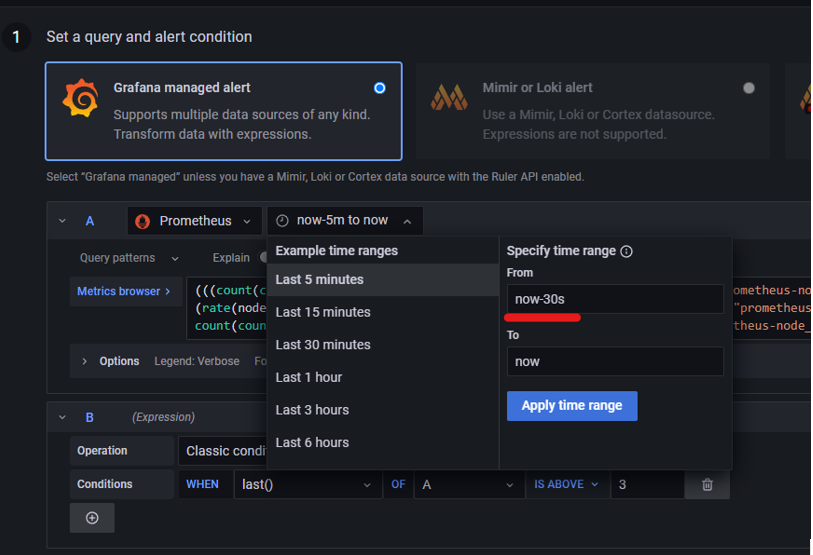
STEP 4:
This is the part where we set our query values for evaluation.

STEP 5: Alert evaluation behaviour
In the figure below i have set evaluate every 1 min for 5 min. This simply means that our query value will be evaluated every 1 minute for 5 minutes and then only our alert will start firing and get sent to our phone.
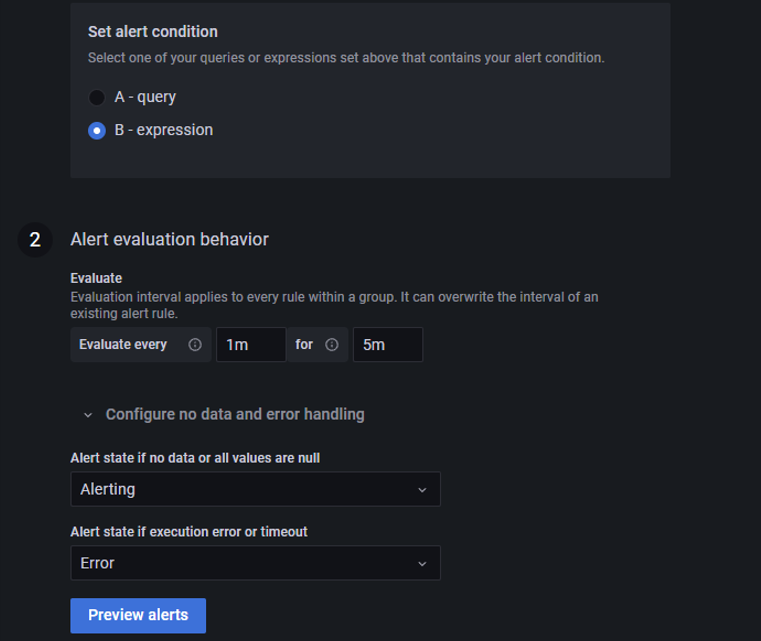
i.e if our CPU usage is above 90 % then grafana will check CPU usage every 1 minute for 5 minutes and if it is above 90% everytime (every 1 min) it checks for 5 minutes then only alert will go off. If cpu usage is 89% in the 4th minute then the whole CPU usage checking will get restarted.
Set the “Alert state if no data or all values are null” to alerting. This is necessary for our alert for server down. However you can just set it to nodata if you are creating alert for high CPU usage. Same thing is true for ”Alert state if execution error or timeout”.
If we set both of then to Ok then we wont get any notification whenever there is no data or there is an error. Also we wont be able to properly identify the health if we set it to ok.
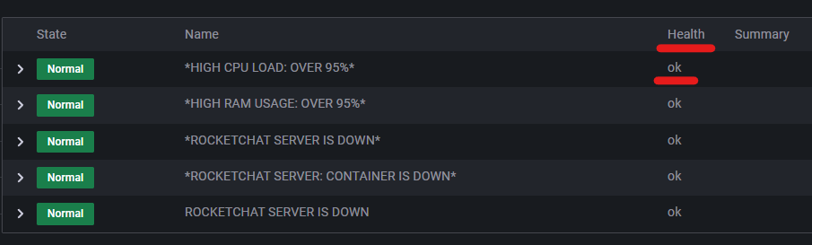
It will just show oK all the time even if there is an error.
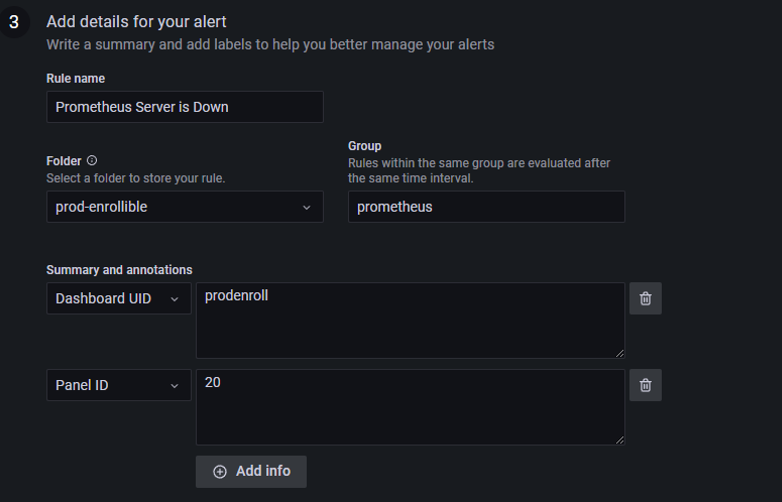
STEP 6:
Give appropriate rulename and slect appropriate folder and group.
You can add more messages in Summary and annotation part.
STEP 7:
Give appropriate label.

In the figure above i have set a label called SMS=SMS. This label is very important because it helps to send our alert to our desired contact point i.e. SMS for now.
Click on Save and exit and your alert will be created.
Now its time to create a policy so that our alert will go to our phone as SMS.
STEP 7:
Go to alerting section and click on notification policies.
In the figure below we can see root policy and i have configured it to be rocketchat. This means that if there is no label (label example: SMS=SMS), then the alert will go to rocketchat channel.

Also there is group wait, group interval and repeat interval. I have set it to 10 min, 5s and 1 hr respectively. This means that if any one alert is firing then it will wait for additional 10 mins before that alert is sent. And if the alert is resolved, then resolved notification will be sent after 5 sec and if alert is still firing for 1 hour then new alert will be sent again.
Now we are going to create a new policy. New policy depends on label. So it is necessary to set proper label for each alert for sending alert to our desired place.

Click on add matcher and set it to SMS=SMS.
Select contact point as SMS. we created this contact point in our previous blog.
Now if you want to override the timing and want it to be different from our root policy. Then click on Override general timings and set your desired timing.
Click on save policy.
Thats it! If you did everything right then you should receive alert in your phone as SMS whenever alert conditions are fulfilled.
Sign up to stay updated with the latest insights, news, and more.