
In this guide, we will learn how to set up cAdvisor in a container using docker-compose file, connect it with prometheus and monitor every containers of our server with the help of grafana.
CAdvisor is a popular tool that is used to collect information about our containers. It is an agent that is used by prometheus and grafana to scrape information and visualize the information in graphs, charts, time series and various other forms. CAdvisor collects various metrics from our containers and that information is scraped by prometheus and then grafana transforms the data into a meaningful form.
CAdvisor is a standalone application. It has native support for Docker containers and also support other container environments such as Kubernetes out of the box.
If you read my previous blog, then you probably have already learnt to setup node_exporter for server monitoring. We made docker compose file and did the setup of Prometheus, Grafana and node_exporter.
Now lets add additional configurations for CAdvisor in our docker-compose file. We will be continuing our previous guide and only add some additional configurations as required. You can look at my previous guide to find the docker-compose file.
Lets configure docker-compose.yml file and start up our containers
sudo nano docker-compose.yml
Now add the following code into it:
cadvisor:
    image: gcr.io/cadvisor/cadvisor:latest
    container_name: cadvisor
    ports:
      - "9200:8080"
    volumes:
      - /:/rootfs:ro
      - /var/run:/var/run:ro
      - /sys:/sys:ro
      - /var/lib/docker/:/var/lib/docker:ro
      - /dev/disk/:/dev/disk:ro
    devices:
      - /dev/kmsg
    networks:
      - prometheus-network
    restart: unless-stopped
In our docker compose file various volumes have been mapped inside our container in read only mode. This is necessary to collect information about our running containers. Our configuration file should look like this:

Now we need to add some configs in the config file for Prometheus that we created previously.
sudo nano config/prometheus.yml
Add the following code inside it:
- job_name: 'cadvisor'
    static_configs:
      - targets: ['cadvisor:8080']
Here, target cadvisor:8080 has been added. This address will only work if both prometheus and cAdvisor containers are in the same network. For remote container monitoring, we simply need to set the address of remote cadvisor and the port 9200 instead of 8080 because we have mapped port 9200 and 8080 of our host and container respectively.
Our config should look like this:

Now lets build our cAdvisor using docker-compose file and then start our containers:
sudo docker-compose up --build –d
and check the status:
docker-compose ps

Looks like cAdvior is running fine. Now go to http://yourserverip:9090/ to access prometheus and check whether our cAdvisor is connected to prometheus or not:
Go to Status->targets.
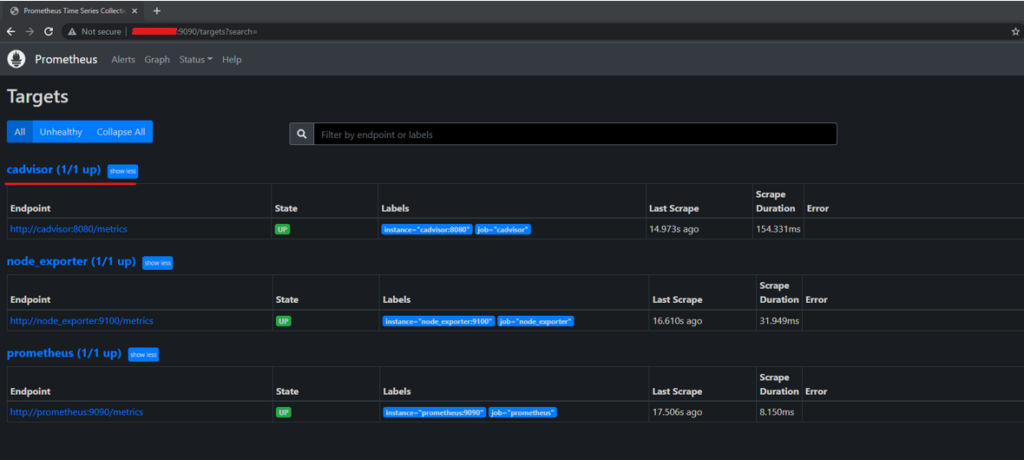
Here we can see that cadvisor is up.
It means that prometheus can scrape data from cadvisor as well.
Let’s login to our grafana server.
Goto http://yourserverip:3000/
Now let’s setup our dashboard for container monitoring.
Go to import:

Now paste 14282 and click on Load
This ID helps us to export full cadvisor dashboard from grafana dashboard library. You can browser more dashboards on https://grafana.com/grafana/dashboards/.
Click on load.

Set name, set the correct preometheus and click on import. You can check my previous blog if you are confused.
After importing, you can see a dashboard. This dashboard is readymade dashboard and contains a lot of information about out containers.

Your dashboard has been loaded with various metrics such as CPU utilization, memory utilization, cache memory, network traffic utilization, etc. There are a lot of other various metrics that you can explore and customize as you need. We can also create our custom dashboard with our own custom queries.
DONE!! VERY EASY RIGHT?
You can also monitor containers from another server with only few modifications. Also, you can set up alert system and send alert messages to your email, rocketchat or slack whenever some abnormality is detected in your server or containers.
In my next blog i will teach you a very easy way to monitor your mysql database using prometheus, grafana, and mysql_exporter.
Sign up to stay updated with the latest insights, news, and more.