

You will have a lot of data when you start a project or a business and you will have some more additional data if/when your business or project grows. Moreover, in the future, you will have to implement Business Intelligence Suite in your project for added data which can be helpful for project data analysis.
But, implementation of Business Intelligence Suite is more about converting the additional data to actionable insights. The amount of data your project or organization can collect today offers the ability to understand which processes are working and help teams prepare for future trends.
However, you will only have some numbers and figures with no context if your project data analysis and comprehension is not proper.
Meanwhile, there isn’t a single right to for project data analysis as it shifts according to your needs and the type of data you collect. There are many different ways to analyze project data, and the approach you take for project data analysis will depend on the type of data you have collected and the specific goals of your project.
Therefore, it is necessary to understand the data type and correlate it with the project data analysis methodology that works the best.
Hence, let us first learn about the types of data that you have to deal with during your project or business.
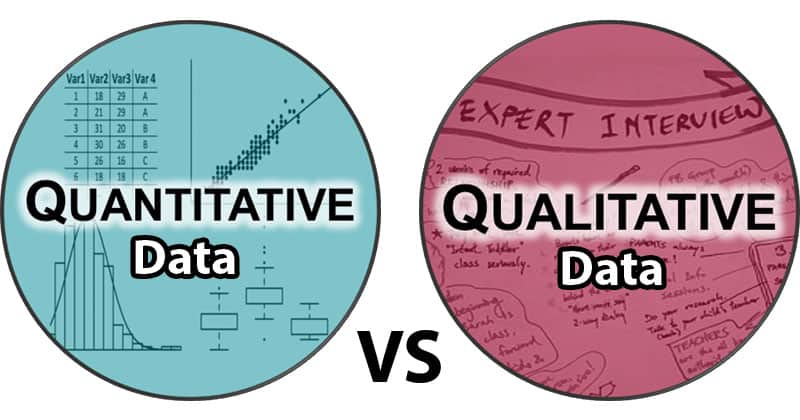
The first and most important step for choosing the best way of project data analysis for your data set is understanding the type of data you have. Basically, you have two types of data – quantitative data and qualitative data.
For the foremost, as the name implies, quantitative data deals with hard numbers and quantities. These numbers or data can include payroll data, revenues, marketing data such as click-through rates, sales numbers and many more similar types of figures that can be quantified.
On the other hand, Qualitative data are comparatively harder to pin down as it pertains to more interpretive and subjective aspects of the project. The qualitative data may include interviews with employees, customer surveys etc.
And, the basic difference in the project data analysis techniques for quantitative and qualitative data is that the project data analysis methods used for qualitative data are less structured than quantitative techniques.
Quantitative analysis methods primarily rely on accurate counting and interpretation of data based on facts. Our first three methods for upping your analysis game will focus on quantitative data:
When you have to make predictions and forecast future trends, regression studies are excellent tools. This is so because regressions measure the relationship between a dependent variable (what you want to measure) and an independent variable (the data you use to predict the dependent variable).
Furthermore, you can have a nearly limitless number of independent variables, while having only one dependent variable. Your project can also be optimized with the help of regressions as it can help you uncover the relationship between factors and highlight trends.
The Monte Carlo Simulation is one of the most used ways to evaluate or calculate the effects of unpredictable variables on a specific factor. Furthermore, risk and uncertainty can be predicted through Monte Carlo simulations as it uses probability modelling.
Monte Carlo simulation will use random numbers and data to stage a variety of possible outcomes to any situation based on any results to test a hypothesis or a scenario. This is an essential tool across a variety of fields, including project data analysis and management, logistics, engineering, finance and more.
It contributes further to your project data analysis as you can understand how random variables could affect your plans and projects by testing a variety of possibilities.
More popularly known as “T Testing,” the Hypothesis testing, analytical method lets you compare the data you have against assumptions and hypotheses you’ve made about your operations. Furthermore, it also helps you forecast the effects of the decisions you could make to your organization.
T Testing or Hypothesis testing lets you compare two variables to find a correlation and base decisions on the findings. For instance, you may assume that more hours of work are equivalent to higher productivity. Before implementing longer work hours, it’s important to ensure there’s a real connection to avoid an unpopular policy.
Unlike quantitative data, a more subjective approach is required for qualitative information and data. Yet, by employing different data analysis techniques depending on your demands, you can still extract useful data . Our final two techniques focus on qualitative data:
The major help that this method provides is understanding the overall themes that emerge in qualitative data. By using techniques like color coding specific themes and ideas helps parse textual data to find the most common threads.
Moreover, when you are dealing with data such as user feedback, interview data, open-ended surveys, and more, content analysis fits in well by identifying the most important areas to focus on for improvement.
This narrative analysis focuses on the way ideas and stories are communicated throughout the project. It helps you better understand the organizational or the project culture.
The narrative analysis might include interpreting how customers perceive an organization, how employees feel about their jobs, and how operational processes are viewed. It can be useful when contemplating changes to the project or corporate culture or planning new marketing strategies.
Lastly, there is no gold standard for statistical analysis or right way to do it. The method you choose should always reflect the data you’ve collected, and the type of insights you want to extract.
Matching the right data and analysis helps uncover better insights to optimize your organization.
Sign up to stay updated with the latest insights, news, and more.